


Managing data might be a bit hard initially because of the presence of numerous rows, columns, formulas, and other features.
Nevertheless, with a thorough understanding of how Google Sheets work, it becomes one of the easiest and most useful means to organize data.
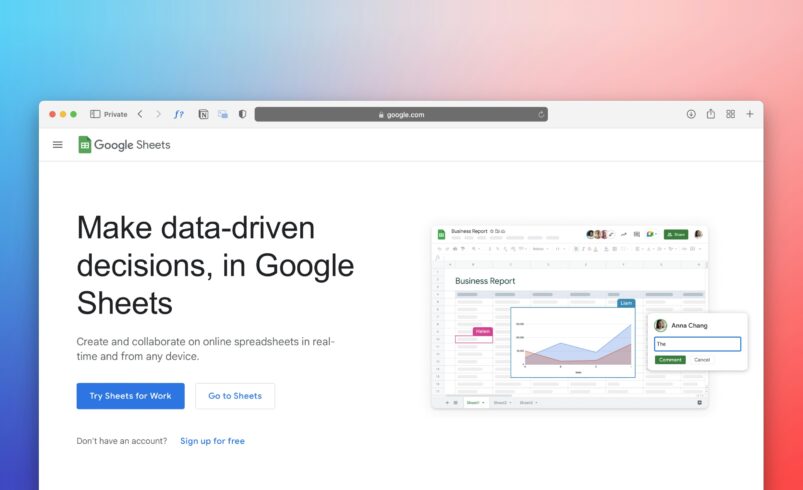
How to Use Google Sheets
Google Sheets is a popular platform used for managing data. It allows users to perform necessary calculations and keep information structured.
Website Link: https://sheets.google.com/
One of the most prominent features of Google Sheets is that it works on the Internet. Also, it supports real-time collaboration. The steps described below will teach you how to use Google Sheets effectively.
How to Create a New Spreadsheet in Google Sheets
To get started, simply open Google Sheets and create a new document.
In Google Sheets, you will find columns and rows which create boxes for entering data. Those squares are called cells.
How to Enter and Organize Data in Google Sheets
You should click any cell and type data in there. In particular, you could use text, numbers, or dates. Usually, columns are used for categories, while rows represent data.
For instance, you may have the following information about one event:
- Name: John
- Date: June 10
- Amount: $50
How to Format Your Sheet in Google Sheets
When working with Google Sheets, you can format your table. For instance, you can change font size, color, alignment, and even highlight some information in a separate color.
Proper formatting makes your table legible and readable.
How to Use Basic Formulas in Google Sheets
Formulas allow performing calculations and operations. You can perform addition, multiplication, subtraction, division, and other actions easily.
Google Sheets suggest formulas which could help you complete the process correctly.
How to Sort and Filter Your Data in Google Sheets
Sometimes, people store a large number of records. To simplify the analysis, they often filter and sort the data.
You can sort data either alphabetically or by ascending/descending values. Filters allow viewing certain data while not changing all the content.
How to Create a Simple Chart in Google Sheets
Creating a chart allows presenting data visually. Google Sheets suggests many options for turning data into charts. Thus, charts make the data understandable and easy to analyze.
How to Share and Collaborate in Google Sheets
Google Sheets supports collaboration and sharing documents. By clicking on the appropriate icon, you can share your sheet with anyone and work together on the same project. This feature might be helpful when collaborating within a team.
Collaboration Website: https://drive.google.com
Basic Tips for Using Google Sheets Efficiently
When creating a sheet, always keep it organized and consistent. Therefore, you must use headings. Moreover, try to minimize the presence of blank rows. Although Google Sheets saves data automatically, you should save the progress regularly.
Mistakes Which Should Be Avoided While Working with Google Sheets
New users of Google Sheets usually make mistakes while entering data without any organization. Consequently, they cannot control the information properly. Another mistake consists of using formulas incorrectly.
Conclusion
Google Sheets is an amazing platform for managing data. With its help, people can organize their information, perform calculations, and collaborate with other people. Undoubtedly, the main advantage is simplicity because you need no special knowledge to work with Google Sheets.